Engagement Metric Variations Emerge in PC and Console Gaming Through Compiled Leaderboard Data
Casey Werner · Aug 20, 2026
Engagement Metric Variations Emerge in PC and Console Gaming Through Compiled Leaderboard Data
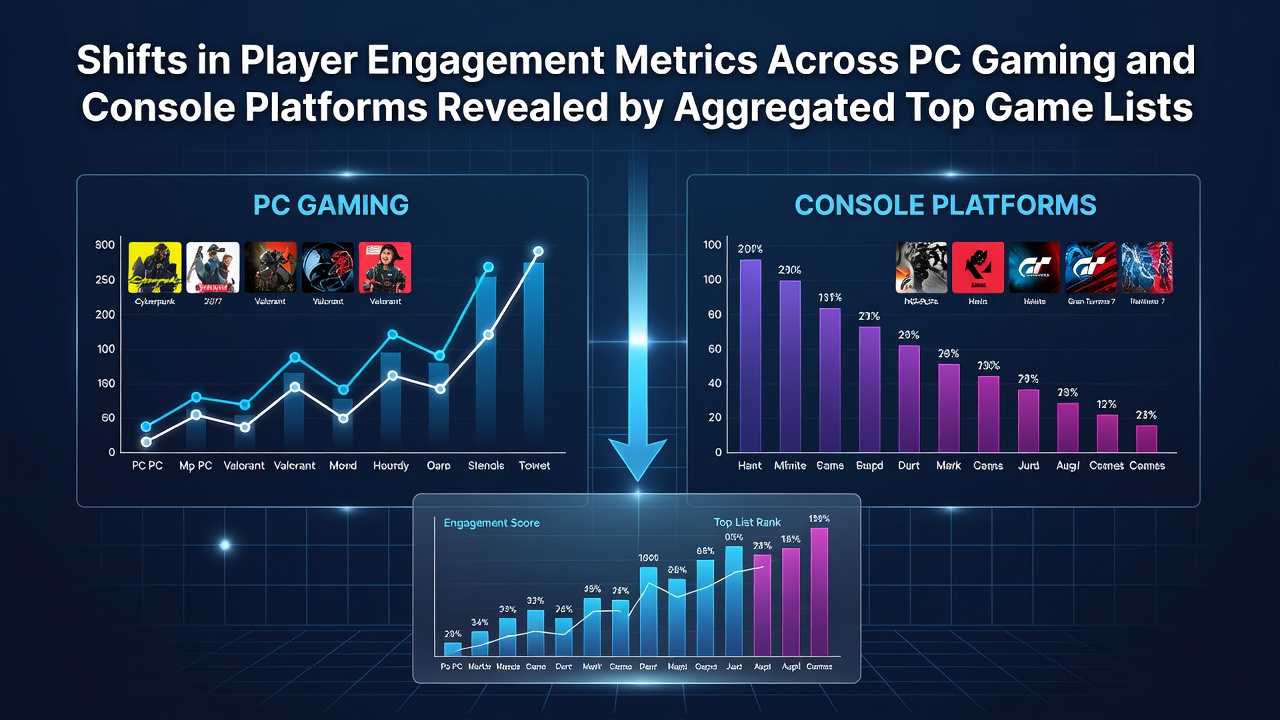
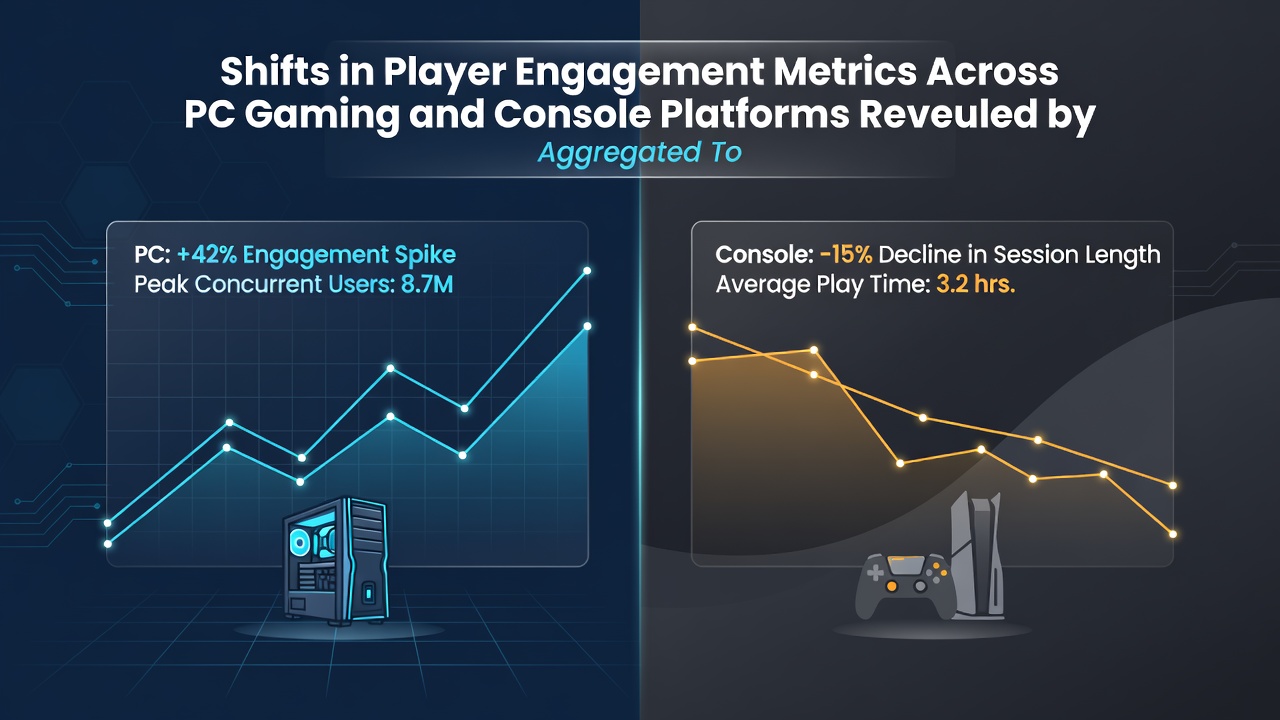
Data compiled from top game lists across multiple platforms shows distinct shifts in player engagement metrics between PC gaming and console environments as of August 2026, with PC sessions averaging longer continuous play periods while consoles reflect more varied session distributions according to aggregated reports from industry trackers.
Steam charts and similar PC leaderboard aggregates reveal increases in concurrent user peaks for certain titles during evening hours, whereas console metrics from sources like PlayStation Network and Xbox Live indicate steadier but shorter bursts of activity spread throughout the day, and researchers tracking these patterns note that cross-referenced lists highlight how free-to-play models on PC sustain higher daily active user counts compared to premium console releases.
Platform-Specific Trends in Session Duration and Frequency
Observers analyzing aggregated top game lists point out that PC players often engage in extended sessions exceeding two hours on average for multiplayer titles, while console data demonstrates a rise in shorter interactions under forty-five minutes, and this divergence appears tied to hardware accessibility factors that allow PC users to remain logged in across background tasks.
But here's the thing: lists from major digital storefronts show PC engagement climbing in genres like strategy and simulation games, whereas action-oriented console charts register more frequent logins but reduced total playtime per session, and figures from the Entertainment Software Association corroborate these platform differences through quarterly hardware utilization surveys.
Genre Influences on Cross-Platform Retention Rates
Top game aggregates indicate that battle royale and live-service titles maintain stronger retention on consoles due to controller optimization advantages, yet PC lists display superior long-term player investment in moddable or competitive esports environments, and studies from the University of Helsinki's game research division have mapped these retention curves using public leaderboard data over multi-year periods.
What's interesting emerges when monthly compilations compare regional variances, since North American console lists emphasize sports simulations with high repeat engagement while European PC charts favor narrative-driven experiences that encourage deeper single-session commitments, and such patterns hold steady through mid-2026 aggregates without significant disruption from new hardware releases.
Those who've examined the data further observe that mobile crossover titles listed in console aggregates pull in fragmented play patterns similar to handheld modes, contrasting with dedicated PC versions that integrate keyboard shortcuts to extend session lengths, and this distinction surfaces clearly in combined top 100 rankings published by multiple tracking services.
Data Aggregation Methods Reveal Underlying Patterns
Aggregation techniques applied to public leaderboards combine playtime statistics, peak concurrent numbers, and review volume to produce composite engagement scores, and these methods expose how PC platforms benefit from always-on connectivity features that boost metrics in always-updating games while consoles show resilience in offline-capable single-player categories.
Yet patterns shift when seasonal events influence lists, since summer 2026 compilations captured elevated console engagement during major tournament cycles whereas PC metrics remained consistent year-round, and analysts cross-referencing these sources emphasize the value of multi-platform data pools for accurate trend identification.
Conclusion
Overall the aggregated top game lists continue to document measurable differences in how players interact with PC and console platforms, with session lengths, frequency, and genre preferences diverging in ways that reflect hardware and ecosystem characteristics, and ongoing data collection through late 2026 promises additional clarity on whether these shifts stabilize or evolve further with upcoming software updates.